
Access Loop Analytics
Access Loop Analytics in three ways:
- From the Dashboard Sidebar, select Analytics to see the analytics overview for all your Loops at once. Select a particular Loop to view detailed analytics for that Loop.
- From the Looplet Dashboard, click the View Analytics icon on any Loop to see detailed analytics for that Loop.
- From a Loop Detail Page, select the Analytics button to view detailed analytics for that Loop.
Analytics Dashboard
Overview of all Loops
The main Analytics Dashboard provides a snapshot of how all your Loops are performing.
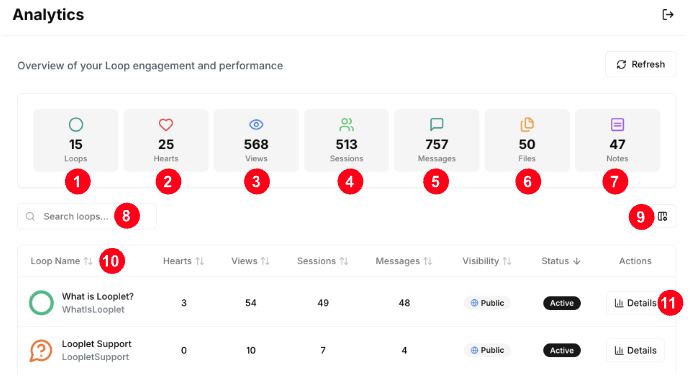
- The total number of Loops in this account.
- The total number of hearts sent to all of your Loops.
- The total number of Loop views all of your Loops have received.
- The total number of chat sessions across all of your Loops.
- The total number of messages your group members have sent in the chatbot across all of your Loops.
- The total number of files across all your Loops.
- The total number of notes across all your Loops, including active and inactive notes.
- Search for a Loop by Loop Code.
- Customize which columns are shown in the Loop table
- Sort your Loops by column. Click the up/down arrows next to the column name to sort by that column.
- Click Details in any Loop row to view detailed analytics for that Loop.
Detailed Analytics by Loop
The detailed analytics page shows information specific to a Loop.
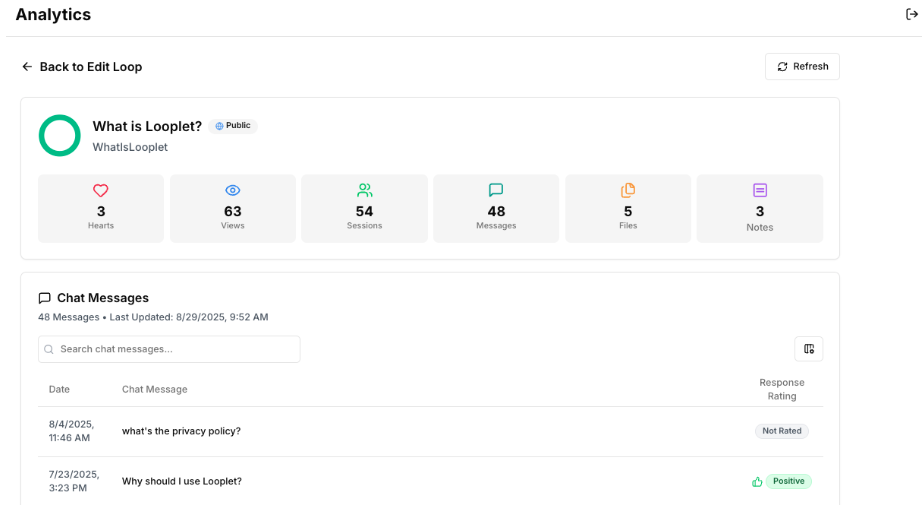
Top section: overall statistics
This is the same information shown on the overview of all Loops.
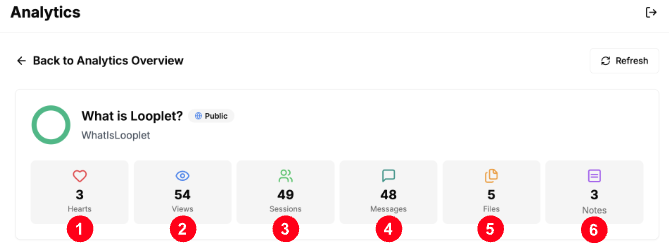
- Shows the total number of hearts sent to this Loop.
- The number of Loop views your Loop has to date.
- The number of chat sessions your Loop has to date.
- A single session belongs to one unique user and includes all activity until that user closes the Loop (closes the tab, closes the browser window, or switches to a new Loop).
- If the user leaves the Loop page but does not close it, then the same session will resume the next time the user visits the page.
- The total number of messages your group members have sent in the Loop chatbot to date.
- The number of files you have uploaded or created in the Loop.
- The number of notes in the Loop. This includes active and inactive notes.
Bottom section: chat history
You can see all the messages your group has sent in the chatbot.
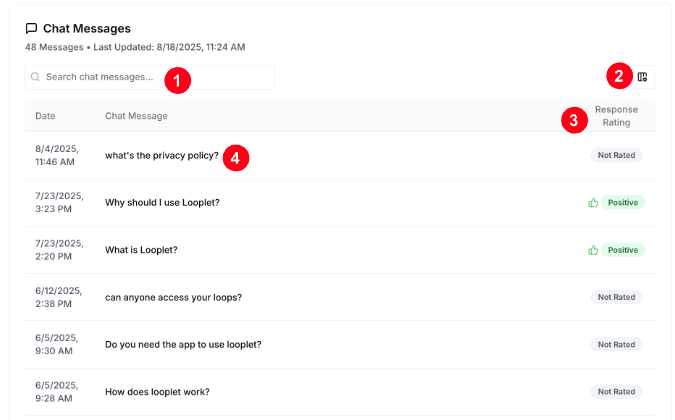
- Search for keywords or phrases to show only messages with those themes.
- Customize which columns are shown in the Chat Messages table, including language and Session ID.
- The response rating provided by the person asking the question.
- This is useful to see what questions that chatbot answers well and what questions it might need clearer documentation for.
- Note that people rarely rate responses.
- Click on a chat message to view it in context. See the chatbot response and any previous or later messages and responses.